
Water is an one component system which is chemically a single compound involved in the system. The three possible phases in this system are ice(solid phase), water(liquid phase) and vapour(gaseous phase).
Hence, water constituents a three phase and one component system. Since water is a three phase system, it can have the following three equilibria-
Ice ⇌ Vapour
Ice ⇌ Water
Water ⇌ Vapour
i.e. Ice ⇌ Water ⇌ Vapour
Each equilibrium involves in two phases. The nature of these phases which exist in equilibrium at any time depends on the conditions of temperature and pressure. These conditions have been determined and summarized in the pressure-temperature diagram in which pressure is treated as independent variable.
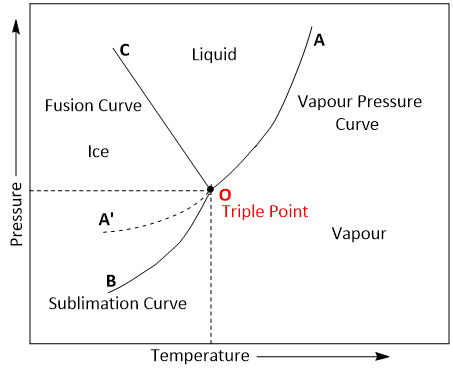
The phase diagram consists of-
- Curves: There are three curves OA, OB and OC
- Areas: Three curves OA , OB and OC divide the diagram into three areas AOB, AOC and BOC.
- Triple point: The above three curves meet at the point O and is known as triple point.
- Metastable equilibrium: The curve OA represents the metastable equilibrium.
Curve OA
The curve OA is called vapourisation curve and represents the equilibrium between water and vapour. At any point on the curve the following equilibrium will exist-
Water ⇌ Water vapour
Applying phase rule equation on this curve-
F = C – P + 2
or, F = 1 – 2 + 2
or, F = 1
The degree of freedom of the system is one, i.e, univariant.
Curve OB
The curve OB is called sublimation curve of ice and represents
the equilibrium between ice and vapour. At any point on the
curve the following equilibrium will exist-
Ice ⇌ Vapour
Applying phase rule equation on this curve-
F = C – P + 2
or, F = 1 – 2 + 2
or, F = 1
The degree of freedom of the system is one, i.e., univariant.
Curve OC
The curve OC is called melting point curve of ice and represents the equilibrium between ice and water. At any point on the curve the following equilibrium will exist-
Ice ⇌ Water
The curve OC is slightly inclined towards pressure axis. This shows that melting point of ice decreases with increase of pressure.
The degree of freedom of the system is also one. i.e., univariant.
Areas
Area AOC, BOC , AOB represents water, ice and vapour respectively. In order to define the system at any point in the areas, it is essential to specify both temperature and pressure.
Applying phase rule equation on the area-
F = C – P + 2
or, F = 1 – 1 +2
or, F = 2
So, the degree of freedom of the system is two. i.e., Bivariant.
Triple point (Point 'O')
At triple point all the three phases (i.e. ice, water and vapour) coexist. Thus the value of Phase(P) is 3. Applying phase rule equation, the degree of freedom at this point is zero. It means that three phases can coexist in equilibrium only at a definite temperature and pressure.
At this triple point, neither pressure nor temperature can be altered even slightly without causing the disappearance of one of the phases.
Curve OA' ( Metastable equilibrium)
The curve OA' is called vapour pressure curve of the super-cool water or metastable equilibrium. The following equilibrium will exist-
Super-cool water ⇌ Vapour
Supercooled water is unstable and it can be converted into solid by slight disturbance.
Summary of Phase Diagram of Water System
| Curve/Area/Point | System Name | Phases in Equilibrium | Number of Phases | Degree of Freedom |
|---|---|---|---|---|
| Curve OB | Vaporization | Liquid & Vapour | 2 | 1 |
| Curve OA | Sublimation | Solid & Vapour | 2 | 1 |
| Curve OC | Fusion | Solid& Liquid | 2 | 1 |
| Curve OA' | Metastable | Liquid & Vapour | 2 | 1 |
| Area AOC | Ice | 1 | 2 | |
| Area BOC | Water | 1 | 2 | |
| Area AOB | Vapour | 1 | 2 | |
| Point O | Ice, Water & Vapour | 3 | 0 |
Related Topics:
Phase Diagram of Lead Silver System
Phase Diagram of KI-Water System