
Phase Diagram of Potassium Iodide–Water System
KI–H2O System has four phases- Solid KI, Solution of KI in water, Ice and Vapour. Only two chemical constituents KI and H2O being necessary to depict the composition of all the four phases. So, it is a two-component system.
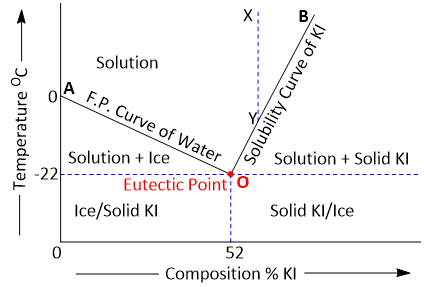
Since the conditions for the existence of the various phases are studied at atmospheric pressure, the vapour phase is ignored and the system KI-H2O is regarded as a condensed system. Pressure being constant, the two variables, temperature and concentration will be considered. The T-C diagram of the system is shown below.
KI–H2O System consists of-
- Curves AO and OB
- Eutectic Point O
- The area above AOB and the areas below the curves OA and BO
Curve AO
The point A represents the freezing point of water or the melting point of ice (0ºC) under normal conditions. The curve AO shows that the melting point of ice falls by the addition of solid KI. As more and more of KI is added, the concentration of solution and the melting temperature changes along the curve AO. The phases in equilibrium along the curve AO are ice and solution.
Applying the reduced phase rule equation to the condensed system ice/solution, we get the degree of freedom-
F = C – P + 1
or, F = 2 – 2 + 1
or, F = 1
Thus the system is monovariant.
Curve BO
At O, the solution is saturated with KI. Thus the curve BO depicts the effect of temperature on the concentration of saturated solution or the solubility of KI. The phases in equilibrium along the curve are solid KI and solution.
Applying the reduced phase rule equation, we get the degree of freedom-
F = C – P + 1
or, F = 2 – 2 + 1
or, F = 1
Thus the condensed system solid KI/solution is monovariant.
Eutectic point
The lowest point attainable by the addition of KI along the curve OA is O.
Here the solution becomes saturated with KI and the solid KI appears as the third phase. This point is termed the Eutectic Point or Cryohydric Point as one of the components in the system is water.
Applying the reduced phase rule equation to the system ice/solid KI/solution at point O.
F = 2 – 3 + 1
or, F = 0
Hence the system is nonvariant. That is, both the temperature are fixed.
The Area above AOB
It represents the single phase system 'solution'.
Applying the phase rule equation-
F = C – P + 1
or, F = 2 – 1 + 1
or, F = 2
Therefore the system is bivariant.
As labelled in the diagram, the area below AO shows the existence of ice and solution, while the area below BO depicts the presence of solid KI and solution. Below the eutectic temperature line, there can exist ice and solid KI only.
Summary of Phase Relations
| Region/Curve | Phases in Equilibrium | Degree of Freedom | Type of System |
|---|---|---|---|
| AO | Ice + Solution | 1 | Monovariant |
| BO | Solid KI + Solution | 1 | Monovariant |
| O (Eutectic) | Ice + Solid KI + Solution | 0 | Nonvariant |
| Above AOB | Solution | 2 | Bivariant |
Related Topics:
Phase Diagram of Lead Silver System
Phase Diagram of Water System